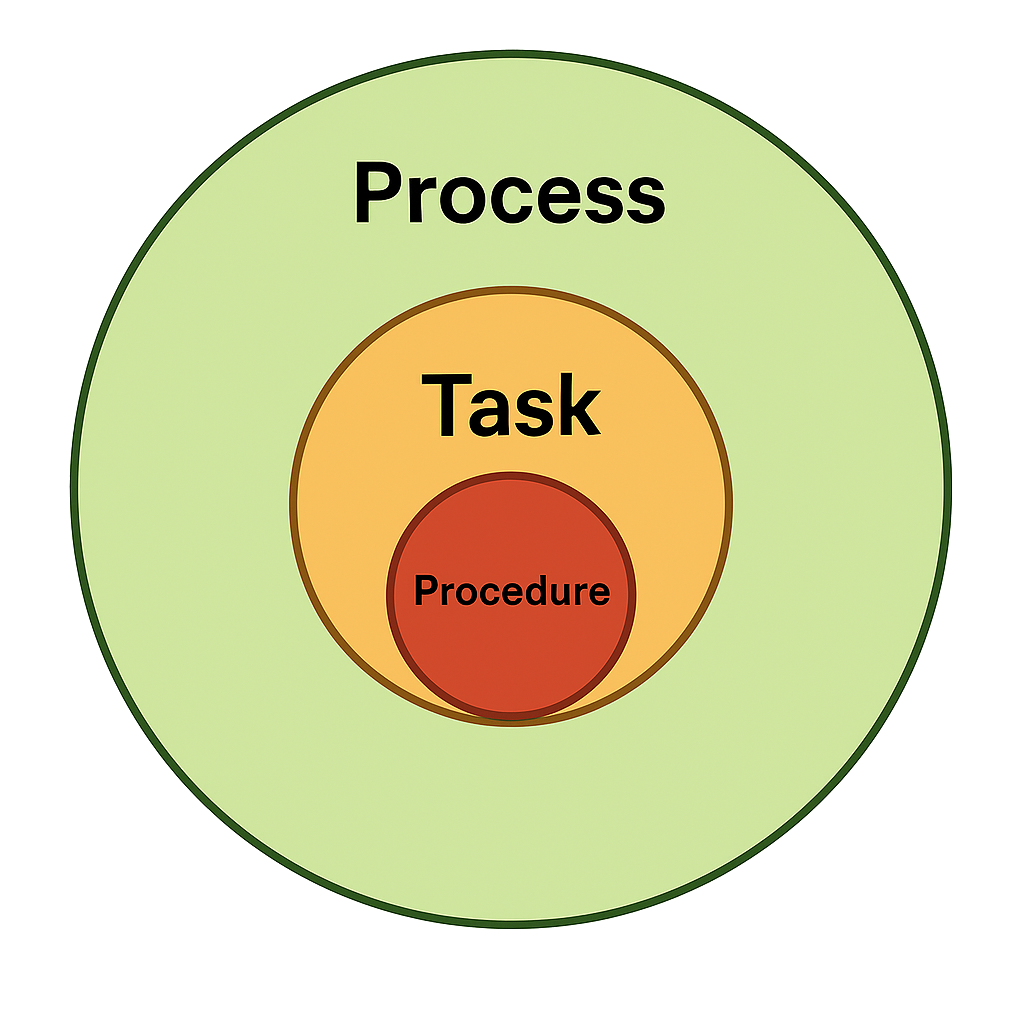
Process: A series of progressive and interdependent steps by which an end is attained; a series of interrelated procedures usually crossing department lines or roles.
Task: A short-term, single assignment. In process mapping, tasks are usually the boxes within the process.
Procedure: The sequence of actions or instructions to be followed in solving a problem or accomplishing a task; the step-by-step actions used to complete a task.
As you begin your process improvement journey, you may encounter terms such as LEAN, AGILE, and TQM. These are methodologies for continuous improvement and all play a role. Each of these methodologies have a multitude of tools that can be used. And many of the tools cross between methodologies. Depending on the process to be improved, you will most likely choose methods and tools from various methodologies; you are not limited to just one. This toolkit pulls together some of the most commonly used tools at NMSU for process improvement. For a complete library of tools and templates that can be used, look at the American Society for Quality (ASQ) website.
Process identification and improvement facilitation is offered free-of-charge by the Center for Learning & Professional Development for NMSU teams that need a little more guidance and support of the process.
Before beginning any process improvements, it is important to decide which processes should be improved. This is done through a Process Evaluation and Analysis. Begin by creating a list of key processes (no more than 10) to evaluate. Everyone who shares responsibility for all or part of the processes should complete the Process Evaluation. Once you have collected all the evaluations, use the Process Analysis & Selection workbook to analyze the results. These two templates work together and all formulas are built in. Instructions are included in each workbook.
Metrics
Once you have determined the process for improvement efforts, collect your baseline metrics. Typical metrics may include the number of actions, number of errors, types of errors, time to complete, etc. Don't limit yourself to just quanitfiable metrics. Metrics can also include survey results or stakeholder antedotal evidence. Metrics help you determine if your analysis is correct and will be used after improvements are implemented to determine if the improvements you implemented increase the process' value.
Who should be included on your process improvement team? It is easy to only include your immediate team in a process improvement project but this rarely will bring about lasting, valuable change. To fully understand the value, errors, and opportunities you must include representatives from all Stakeholder groups. The RACI matrix is a tool to help identify who should be included on the team, as it identifies who is Responsible, Accountable, Consulted, and Informed.
To ensure everyone on the team has a clear understanding of the process, it is necessary to map the process. While there are multiple tools for process mapping, Swimlanes and PERT charts are two of the easiest and most helpful. Swimlanes show the flow of steps through a process. This is especially helpful when a process crosses functional lines. PERT charts show the order of steps along a timeline and are helpful when the time to complete a process is evaluated for improvements. When intially creating your process maps, it is recommended to use sticky notes for each step of the process and post them to flipcharts or use a virtual whiteboard. This allows you to easily move items around as details are identified.
Converting your sticky notes and flipcharts into a professional, clean map is recommended. Microsoft Visio is the best tool for creating maps but you can also use Excel, PowerPoint, or even Word. Visio is available for NMSU employees as part of the full Microsoft Office Suite. Visio includes a plethora of process improvement shapes but they can sometimes be hard to find. To make them easier to fine, we have collected some of the most frequently used shapes in the links below.
Once the process is mapped, the next step is to determine the causes & effects of waste, bottle-necks, or inefficiences. It is absolutely crucial that stakeholders be included in this phase. Several tools are available for this phase. For each step in the process, determine if it adds value to the customer/stakeholders and identify any waste and inefficiencies. Using a 5 Why's technique is a quick and easy way to start analyzing the cause of any waste identified.
By now, you should have a good idea of where issues exist and what the impact is in your process and you can now begin looking at improvement options. Again, stakeholders should be included in this step. They will be able to tell you if you are heading on the right path and may have ideas of their own of how to improve the process.
Putting your plan into action requires organization, communication, teamwork, and monitoring. This is why project management is a growing field. The Project Management Institute and PROSCI are leading authorities in this field. The links below are some resources for project management and change management efforts. Communication and Metrics are two key components. Process Improvement cannot occur in a vacuum. Refer to your RACI Matrix and determine who needs to be consulted and who needs to be informed about upcoming changes. Refer to the metrics you created in step one and track changes to the baseline. If you see a downward trend or little movement, you may need to adjust your improvement plan or look for alternative solutions.
Remember, the goal of process improvement is to IMPROVE. This is why we call it CONTINUOUS process improvement. If you aren't measuring and reevaluating your process, your improvement efforts will not be sustainable.